Playing With Real(ish) Data: Visualizing the Books I Read Last Year
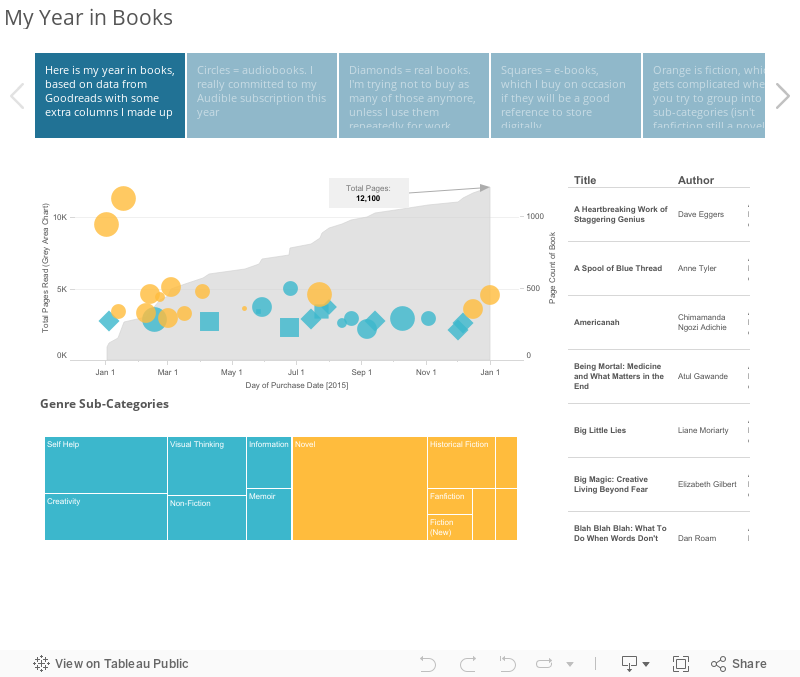
/I haven't played with Tableau in forever, so I thought it would be fun to dust off my skillz and play with some data from Goodreads. I crushed a lot of books last year, thanks to an Audible subscription and being constantly on the road with earbuds in my ears. I am new to Tableau public, and am not even sure this embed of my dashboard will work, but I'm going to give it a try. The only way to find out if it works is to publish...so here goes...
UPDATE: It worked! Small caveat, of course it is not responsive so don't even bother trying to look at this unless you are using a laptop or desktop computer. Maybe I'll play around with a mobile friendly version in the future, or maybe I won't :)